Pivot points : Modifying timeframe and adding a price tag

Hello everyone,
I'm not an advanced coder so I'm gonna need some help on this one :
I'd like to have pivot points based on other timeframe than daily : hourly, weekly & monthly. I had a look at the code and I guess this part of the code should be modified, but I don't know how to manage it :
"map(d, i, history) {
// Detect period transition
const isNewPeriod = i > 0 && history.prior().tradeDate() !== d.tradeDate();
// When to start plotting
this.started = (i === 0) ? false : (this.started || isNewPeriod);"
Moreover, I'd like to change the format of the pivot point indicator by showing only the actual period with a price tag on the right, and not the previous ones, just like in the picture below :
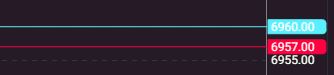
What you see here are the price level settings, but I haven't been able to reproduce this type of output for pivot points.
If anybody knows how to make these modifications it would be really helpful!
Regards,
Thomas Coget
-

Happy weekend,
I am also interested in the weekly pivots. But I couldn't find anything about getting the weekly data or the last week's daily data within TVO.
So, is there a possibility to get the weekly candles when showing the chart in a lower time frame?
Or how do I find out more about the `history` class?
Thanks for any ideas or infos and good profits to all,
Alexander -
In the docs the map method has only 2 arguments but in the example codes there's `history` added.
Where can I find details about it?
Is there a part of the documentation I did not find yet?Thanks!
Please sign in to leave a comment.
Comments
2 comments