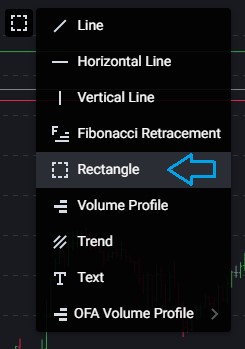
You can add a Rectangle to the chart by clicking the Drawing Tools on the left side of the chart:
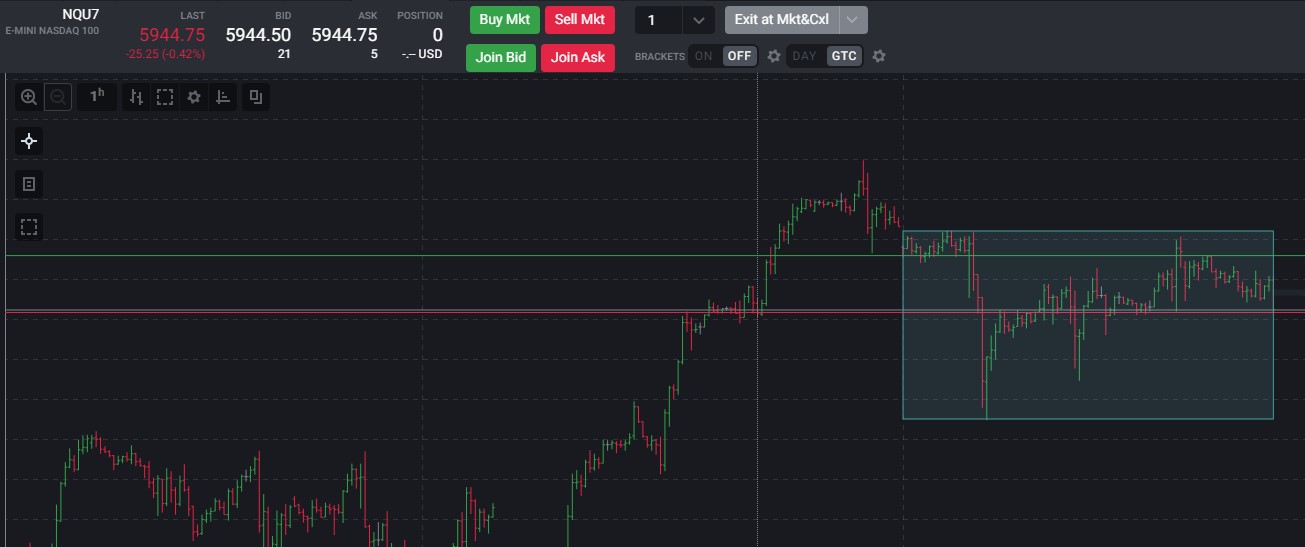
Once selected, click once on the chart to start drawing the rectangle and as you move your mouse, the rectangle will show where you are drawing it and then click a second time to complete the rectangle.
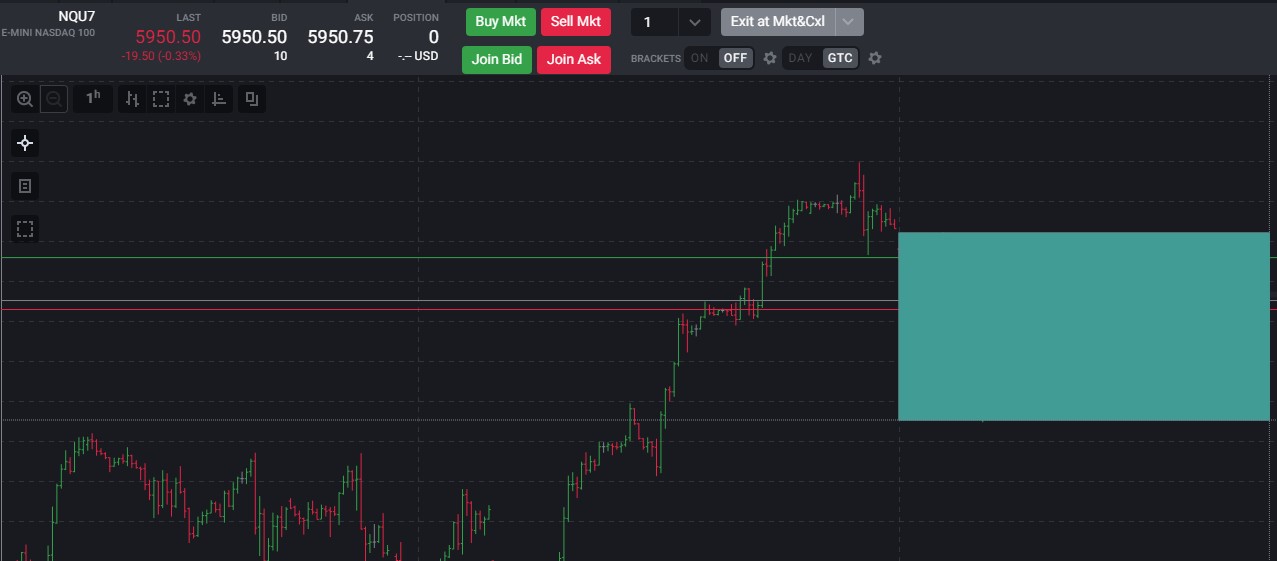
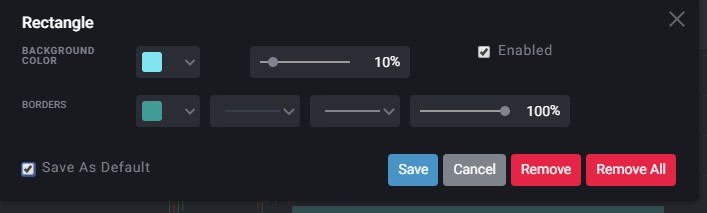
By default, this rectangle will be at 100% opacity. Once the rectangle is added to the chart, you can double click the border of the rectangle to modify the settings and save them as default so all future rectangles are drawn with your settings: